In-house project
Website: http://pycreeper.lenkaspace.net
Website: http://pycreeper.lenkaspace.net

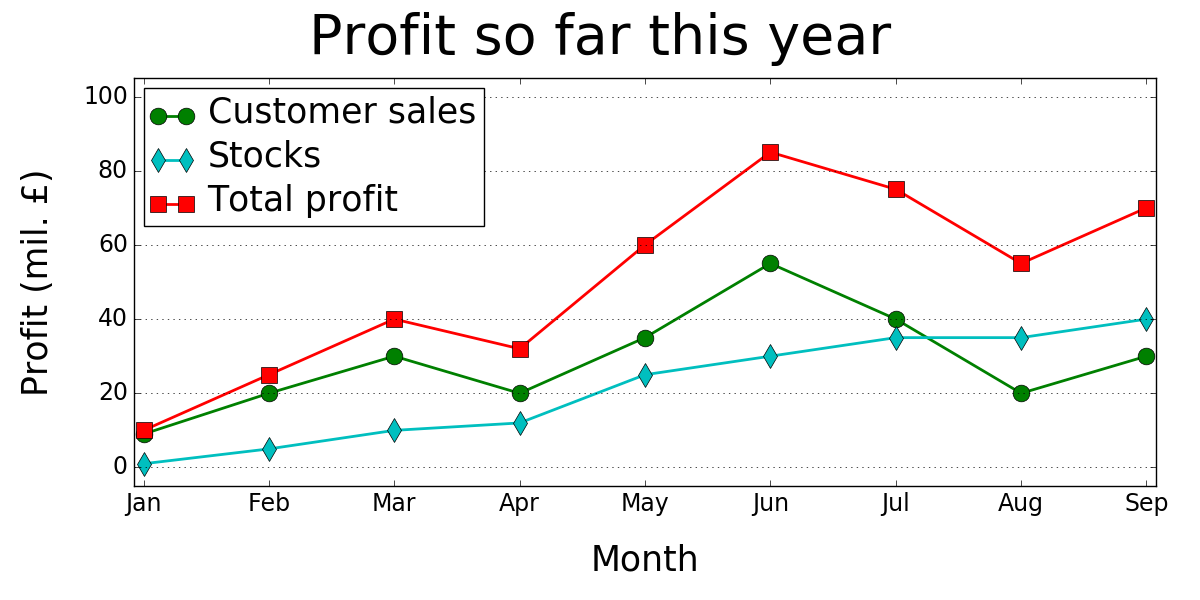
The main purpose of the library is to wrap tens of lines of Python code, that one normally needs to create publication-ready plots with matplotlib, into one-line function calls that follow an established pattern. PyCreeper takes away a data scientist's need to understand various quirks of matplotlib and instead provides ready-to-use and well-documented code.
The following plot types are supported in pyCreeper:
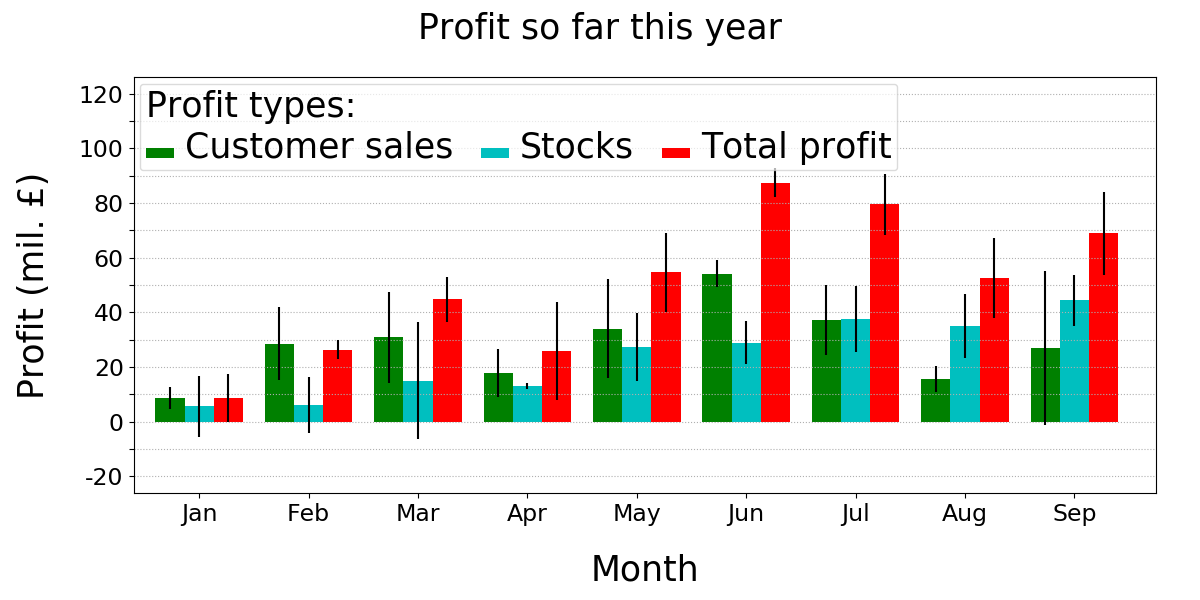
Bar plots
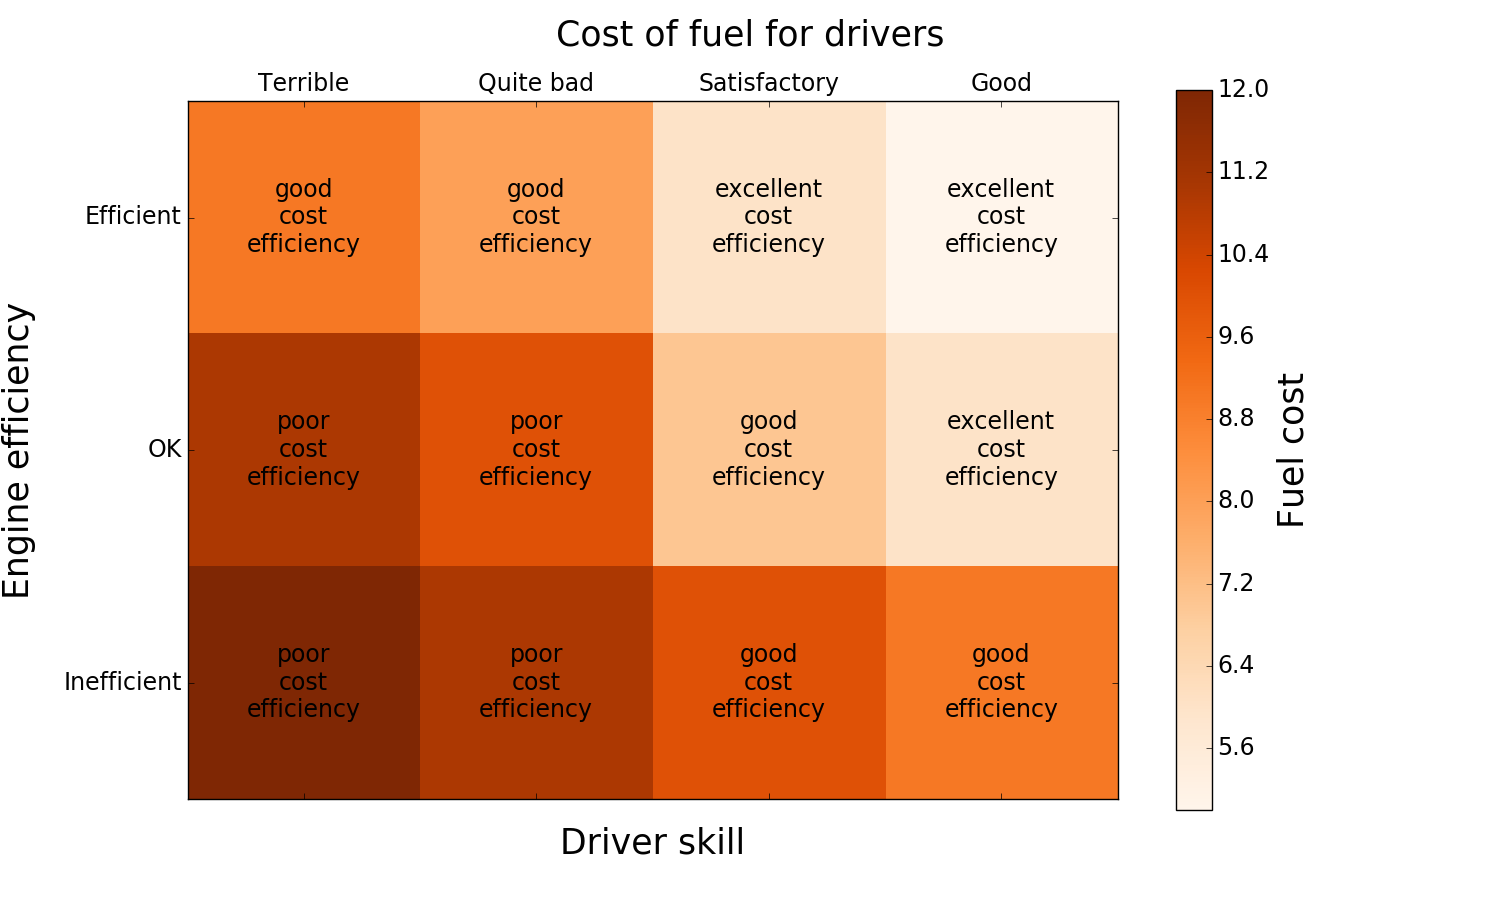
Matrix plots
Pie charts

Box plots

Line plots
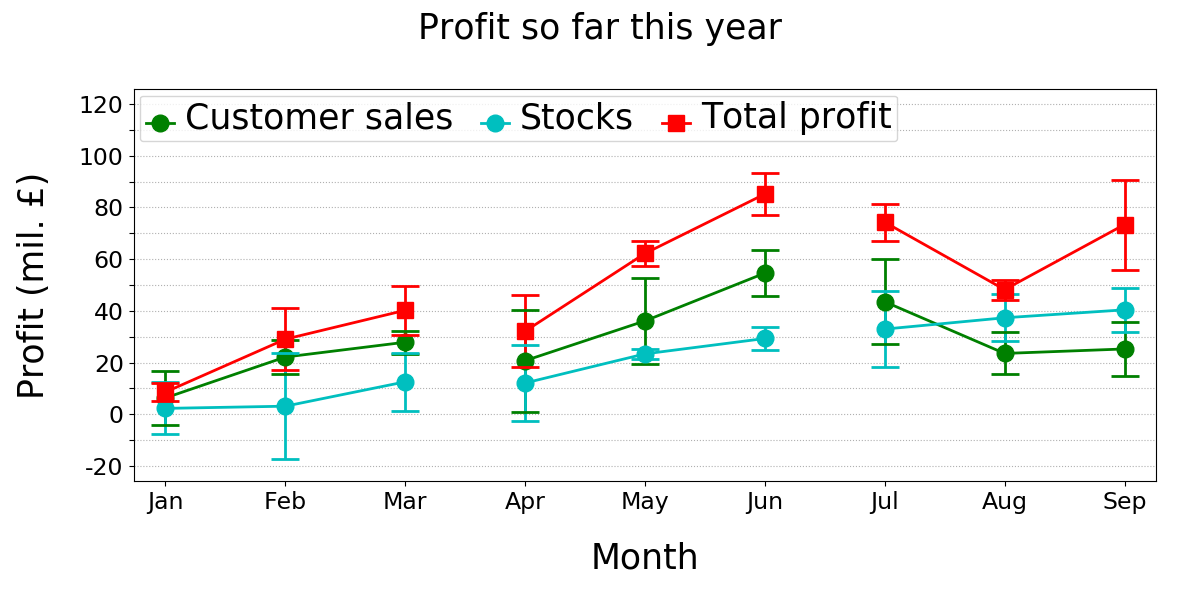
Each plot type offers a number of customization options on how data is logically organized within the plot image.
Styling
A very useful feature of pyCreeper is styles. Without needing an in-depth knowledge of matplotlib, one can quickly setup colors, line widths and fonts of their plots. Perhaps more importantly, the default styles of pyCreeper make visual sense and result in publication-quality plot images.Because I am a big fan of good object-oriented programming principles, styling is fully encapsulated withing the crGraphStyle class, which uses enumerations and type checking to ensure that only valid styles are being applied.